Abtract:
Vietnam, with its advantageous coastal geography, possesses significant potential for the development of wind energy. This paper utilizes GIS technology in combination with the Fuzzy Logic method to evaluate the feasibility of establishing offshore wind farms. The study incorporates 12 criteria related to natural resources, socio-economics, and the environment, including wind speed, wind energy density, seabed bathymetry, distance to oil/gas fields, distance to gas pipelines, distance to submarine cables, distance to fishing areas, distance to seaports, distance to shipping lanes, distance to protected areas, distance to shoreline, and distance to sea turtle feeding areas. The results indicate that the potential area for offshore wind farm development covers more than 130,230 km2, equivalent to 886.87 GW. Among this, approximately 11.00% (nearly 14,330 km2, equivalent to 142.35 GW) of the potential area is suitable for nearshore wind farms with water depths below 20 m. Additionally, around 116,000 km2 (744.52 GW) of the area exhibits potential for constructing fixed and floating foundation wind farms with water depths ranging from 20 to 1,000 m.
Keyword: GIS, Fuzzy Logic, wind farm, Vietnamese coastal area.
JEL Classifications: R58, Q58, Q55, R10.
1. INTRODUCTION
Energy is always a top concern for many countries around the world. In recent years, to solve problems related to energy supply shortages as well as reduce pressure on increasingly depleted fossil fuel sources and deficits and make the most of available potential. In Vietnam, the Government has decided to use and promote the development of renewable energy sources. With a favorable geographical location in the tropical monsoon climate zone with a strong average wind speed in the East Sea of Vietnam and a coastline stretching over 3,200 km, there is potential for wind energy development in the region. The sea in Vietnam is extremely large.
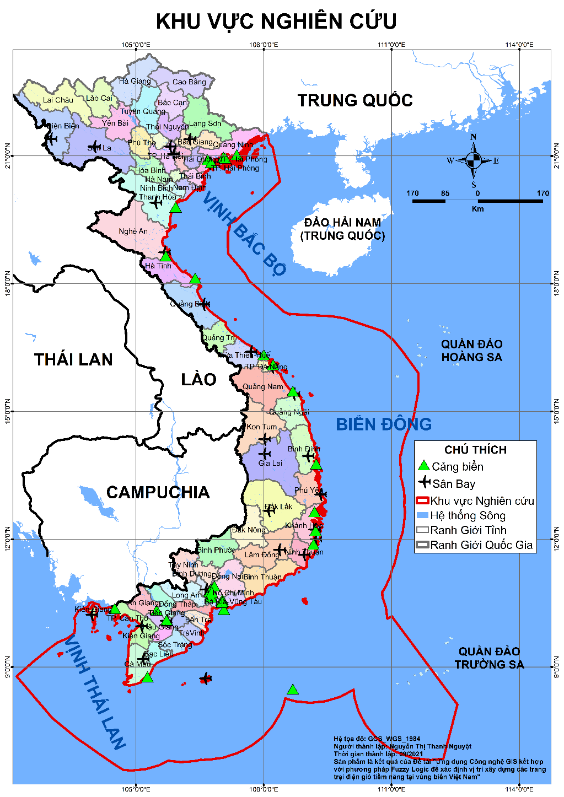
Figure 1. Scope of the study area
In recent years, domestic and foreign research groups and organizations have conducted many scientific studies and reports assessing the potential of offshore wind power in Vietnam using different methods. However, most of these studies and reports have not considered factors related to sustainable development goals such as marine protected areas, navigational channels, feeding locations of marine animals and fishermen. environment of some fisheries, etc. Therefore, this study was conducted using GIS technology combined with the Fuzzy Logic method for each criterion of natural resources, economy – society and environment with the goal of Establish a map of areas capable of building wind power farms in Vietnamese waters to help authorities and investors localize and save time searching for investment locations in the early stages of the project. project as well as contributing to local socio-economic development planning. This method is applied in the Vietnamese sea area about 200 km from the shore (Figure 1) – this is an area with a relatively high concentration of wind speed and average wind energy density at an altitude of 100m.
2. DATA AND METHODS
To establish a map of areas where potential offshore wind power plants can be built, the research team based on the criteria set out by the World Bank in the Final Report “Roadmap for offshore wind power development for Vietnam”. Nam” as well as the availability of data layers. Specifically, in this article, the team has identified 12 available criteria (Table 1) to create a map for building potential wind power farms.
The above criteria layers are standardized according to the Fuzzy algorithm at the same scale from 0 – 1 and aggregated into a map of areas where potential offshore wind farms can be built.
2.1. Methods of collecting and synthesizing documents
Documents collected and analyzed for research include:
a) Attribute data: Overview of natural characteristics of Vietnam’s sea area; regulations and circulars on industries operating at sea (oil and gas, marine protected areas,…).
b) Spatial data: Types of maps. Map layers corresponding to each criterion are collected, processed and digitized as Table 1.
c) Other related documents: Studies in the world and Vietnam on selecting locations to build wind power farms based on GIS technology combined with Fuzzy Logic method.
Table 1: Collected data layers
| Item |
Data layer |
Year | Data | Source |
|---|---|---|---|---|
| 1 | Wind speed | 2008 – 2017 | Raster
(0.0025o × 0.0025o) |
[5] |
| 2 | Wind energy density | 2008 – 2017 | Raster
(0.0025o × 0.0025o) |
[5] |
| 3 | Bottom terrain | 2021 | Raster
(0.0042o × 0.0042o) |
[10] |
| 4 | Shoreline location | 2020 | Vector | [2] |
| 5 | Location of oil/gas fields | 2020 | Vector | [3], [8] và [16] |
| 6 | Gas pipeline to the mainland | 2020 | Vector | [1] và [8] |
| 7 | Underground internet cables | 2021 | Vector | [13] |
| 8 | Location of seaports | 2021 | Vector | [6], [7] |
| 9 | Maritime density | 2018 – 2021 | Raster
(0.005o × 0.005o) |
[12] và [17] |
| 10 | Fishing grounds of several fisheries | 2019 | Vector | [4] |
| 11 | Conservation areas | 2021 | Vector | [11] và [14] |
| 12 | Sea turtle feeding location | 2020 | Vector | [15] |
2.2. Fuzzy Logic Method
2.2.1. Theory
Fuzzy Logic Theory was published by Zadeh, L.A. first proposed in 1965. This is a mathematical theory that allows solving complex, uncertain and unstructured problems.
The shape of the Fuzzy set depends on different types of membership functions. Currently, there are many different types of Fuzzy membership functions proposed. Fuzzy sets are defined with a lower bound, an upper bound, and values between the lower and upper bounds. However, the research team only lists some typical membership functions used in this article.
The L-shaped function is determined by the following values:

- The linear Gamma membership function, also known as the left L membership function (due to its inverse shape compared to the L-shaped membership function), is determined by two parameters a and b according to the formula:

2.2.2. Implementation process
In this study, the Fuzzy Logic algorithm implementation process includes the following three main steps:
Step 1: Determine value points for evaluation criteria
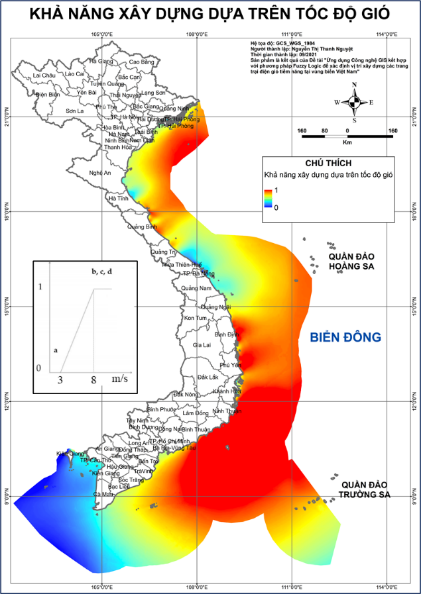
Wind speed
The most important factor to consider when building wind farms is the wind speed in the area. Based on the similarity in optimal wind speed of many current wind turbine research and technologies as well as wind speed data within the study area (ranging from 3.60 – 11.03 m/s), the research team determined that areas with wind speeds below 3 m/s will not be able to build wind power farms, while areas that are completely capable of construction will has a wind speed value greater than or equal to 8 m/s.
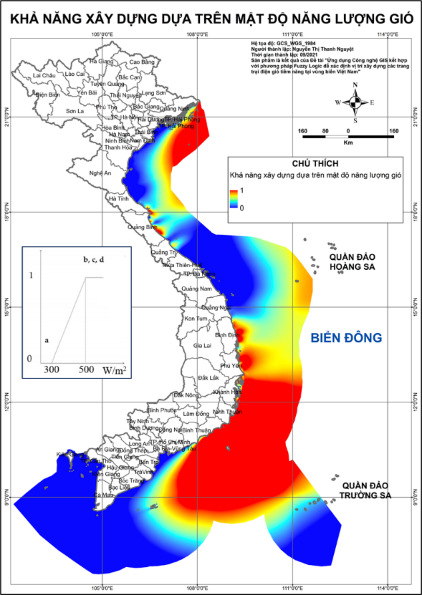
Wind energy density
In addition to wind speed, wind energy density is also considered an equally important factor. For areas with densities lower than 300 W/m2 it will not be energy efficient. In contrast, areas assessed to offer great energy potential have wind energy density greater than 500 W/m2.
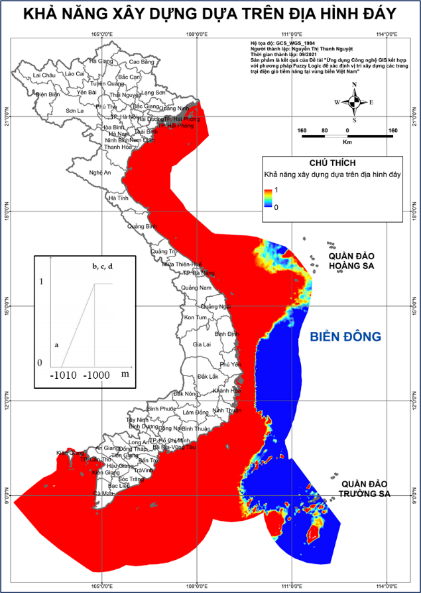
Bottom terrain
In offshore wind power development, water depth significantly affects the economics of the wind power project when designing the foundation. The type of foundation depends on the bottom topography and geological conditions… According to the World Bank, by 2023, the foundations of near-shore wind power plants will be the same type as those of onshore wind power plants with water depth less than 20 m. Meanwhile, fixed foundations have been proven and can be applied in areas with water depths below 50 m; On the contrary, areas with depths from 50 – 1,000 m are considered suitable for wind power plants with floating foundations.
Distance to seaports
The distance of wind farms to seaports is considered an important component contributing to the success of the supply chain for offshore wind power. Because seaports ensure the transportation, transshipment and assembly of parts with large sizes and weights such as propellers, towers, foundations/bases, generators and other parts as well as maintenance later. To reduce transportation costs, the distance from wind farms to seaports is as small as possible. According to the World Bank’s proposal, in the article, the research team identified areas with distances to ports of less than or equal to 60,000 m that are considered optimal; On the contrary, unsuitable areas have this distance greater than 100,000 m.
Distance to study shoreline location
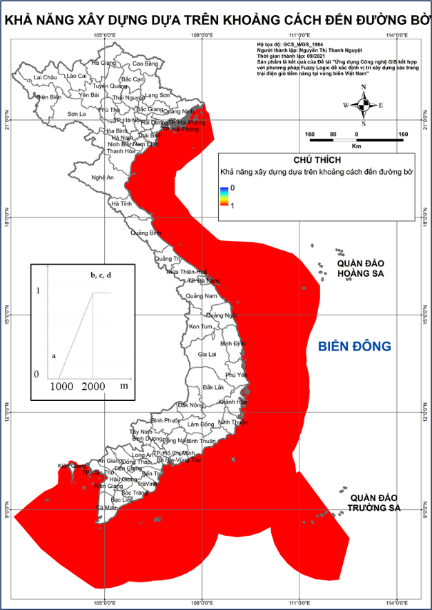
Wind farms near shorelines can have negative impacts on coastal communities. Some argue that nearshore wind turbines reduce the quality of life, reduce property values and affect local economies whose main source of income is recreation and marine tourism. Therefore, to minimize those negative impacts, wind farms should be as far away as possible from the shoreline studied in the article.
Based on country regulations and tower heights as well as wind turbine blade diameters of nearshore and offshore wind turbines by 2030, the research team determined the distance from wind farms to the location. The shoreline studied in this article is at least 1,000 m.
Distance to oil/gas fields; gas pipelines to the mainland; underground internet cables
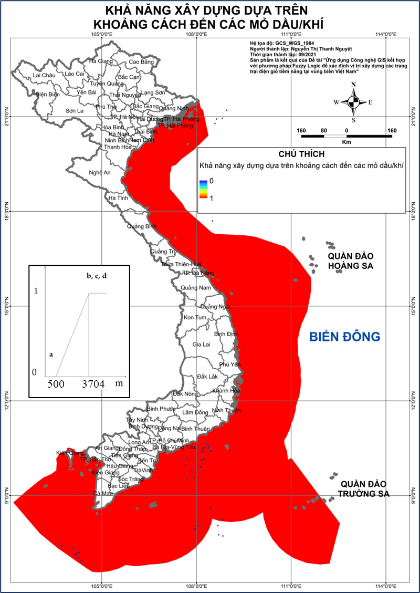
To avoid conflicts with subjects/industries that use the same sea space, before building offshore wind power plants, we should map the current status as well as development planning for each subject/industry. Specifically, oil and gas exploitation areas and underground internet cables. The ideal wind farm is not located on the location of oil/gas fields, gas pipelines to the mainland and underground internet cables.
+ For distances to oil and gas locations and gas pipelines: The authors applied Decree No. 95/2015/ND-CP on Detailed Regulations of a Number of Articles of the Petroleum Law issued in October /2015, to identify areas where the distance to oil and gas fields and gas pipelines is less than or equal to 500 m that will not be capable of construction, and areas with a distance of more than or equal to 3,704 m ( 2 nautical miles) is considered the ideal area.
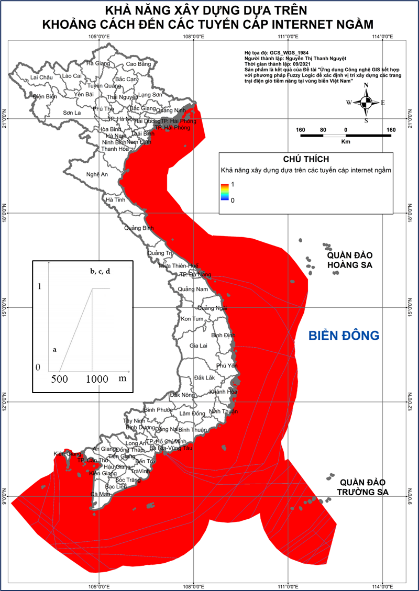
+ For distance to underground internet lines: Currently, many governments have established minimum distances to protect underground internet cables. By the end of 2024, Vietnam is expected to have 7 underground internet cable lines [13]. The majority of these internet cables connect to China and Japan. In addition, within the study area there are also a number of underground internet cables connecting to other countries, most of which belong to China and Japan (FLAG Europe-Asia (FEA), APCN-2,…). Therefore, the authors relied on the safe distance regulations of these two countries to establish the distance to underground internet cables in the study. Areas where the distance to underground internet cables is less than 500 m are not capable of building wind farms, while areas where construction is completely possible have this distance greater or equal. 1,000 m.
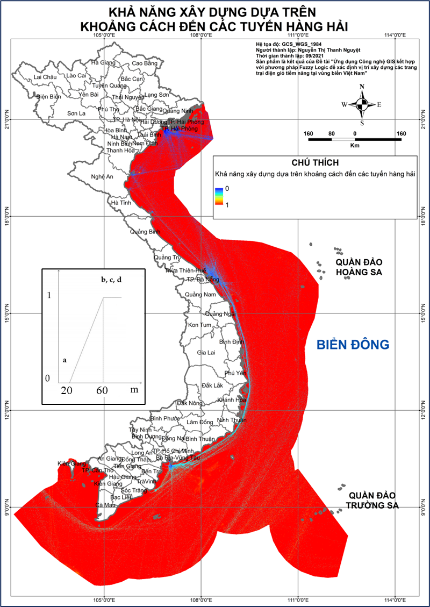
Distance to maritime routes
Similar to the locations of oil fields, gas pipelines to the mainland and underground internet cables, wind farm locations at sea that are not located on maritime routes are the most suitable locations. These locations will not impact any regional shipping routes.
Referring to Section 7, Article 5 of Decree No. 143/2017/ND-CP on Regulations for the Protection of Maritime Facilities, in this study, the group determined the distance of offshore wind farms to maritime routes. The minimum distance in the article is 20 m, and when this distance is greater than or equal to 60 m, that area is completely capable of building a wind power farm.
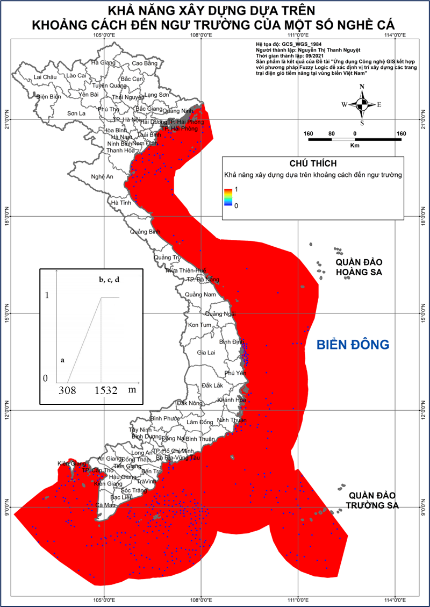
Distance to fishing grounds of some fisheries
The impact of offshore wind power installations on fish habitats and fishing grounds of some fisheries is one of the main socio-economic and environmental issues that need to be addressed during the planning process. wind power development. Fish habitats are disturbed and changed during and after the installation of wind farms. This directly affects the fishing activities of fishermen. Therefore, it is important to know the fish habitat in a water body before making any further decisions about a suitable location. However, currently, in Vietnam there is still no specific research on the impact of wind power at sea on fish habitat. To determine the distance from the wind farm to the fishing grounds of some fisheries, the authors based on the net length of the fisheries. Within the study area, fishing activities are mainly tuna fishing by hand/longline fishing; board pounding; dribbling profession; seine fishing; double fishing and net fishing. In particular, purse seine fishing has the highest net length ranging from 300 – 1,500 m depending on the size of the boat. In addition, some of the main types of fishing vessels in use in Vietnamese waters have a length of about 8 – 32 m. Therefore, in the study, the authors determined the minimum distance from the wind farm to the fishing grounds is 308 m and the optimal distance is 1,532 m.
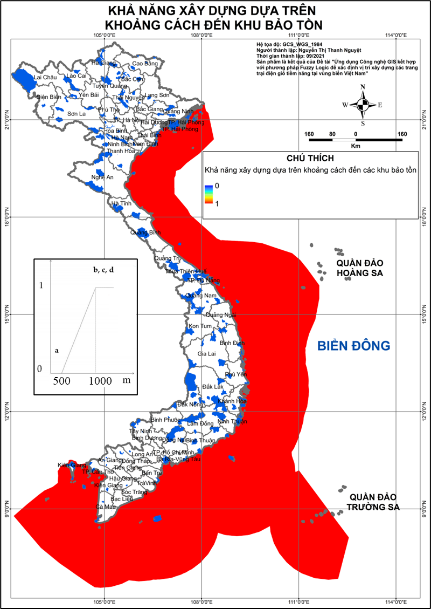
Distance to protected areas and sea turtle feeding areas
Planning for site selection for offshore wind energy development needs to consider the impact on protected areas and sea turtle feeding areas. In the study area, along the coast and islands are places where sea turtles often forage for food and are also places with high ecosystem diversity. Offshore wind turbines may impact species in protected areas (e.g. migration routes, breeding or feeding areas) and sea turtles. Therefore, ideally, offshore wind farms should be located outside of conservation areas and sea turtle feeding areas. The distance from wind farms to these areas should be as far as possible. In the study, the authors relied on Circular No. 10/2014/TT-BNNPTNT on Regulations on criteria for determining buffer zones of special-use forests and protection belts of marine protected areas issued by the Ministry of Agriculture and Rural Development. in March 2014 to determine the distance from wind farms to conservation areas, the minimum and optimal sea turtle foraging areas are 500 m and 1,000 m, respectively.
Step 2: Determine the membership function based on the data
In the study, the membership functions are mainly in two forms, which are linear Gamma and L form. The membership functions are presented in detail in Table 2 below.
Table 2: Function form of the criteria
| Criteria | Fuzzy membership functions and shapes | Value points | Note |
| Wind speed (m/s) – (N1) | Linear Gamma form | a=3,b=8 | Wind speed < 3 equals 0, 3 – 8 increases from 0 – 1, > 8 equals 1 |
| Wind energy density (W/m2) – (N2) | Linear Gamma form | a=300, b=500 | Wind energy density <300 equals 0, 300 – 500 increases from 0 – 1, >500 equals 1 |
| Bottom topography (m) – (S1) | Linear Gamma form | c=-1000, d=-1010 | Distance <-1010 equals 0, -1010 –-1000 increases from 0 – 1, and >-1000 equals 1 |
| Distance to oil/gas fields (m) – (S2) | Linear Gamma form | a=500, b=3704 | Distance <500 equals 0, 500 – 3704 increases from 0 – 1, and >3704 equals 1 |
| Distance to gas pipelines (m) – (S3) | Linear Gamma form | a=500, b=3704 | Distance <500 equals 0, 500 – 3704 increases from 0 – 1, and >3704 equals 1 |
| Distance to underground internet cables (m) – (S4) | Linear Gamma form | a=500, b=820 | Distance <500 equals 0, 500 – 820 increases from 0 – 1, and >820 equals 1 |
| Distance to some fishing grounds (m) – (S5) | Linear Gamma form | a=308, b=1532 | Distance <308 equals 0, 308 – 1532 increases from 0 – 1, and >1532 equals 1 |
| Distance to seaports (m) – (S6) | L form | c=60,000, d=100,000 | Distances <60,000 equal 1, 60,000 – 100,000 decrease from 1 – 0, and >100,000 equal 0 |
| Distance to maritime routes (m) – (S7) | Linear Gamma form | a=20, b=60 | Distance <20 equals 0, 20 – 60 increases from 0 – 1, and >60 equals 1 |
| Distance to protected areas (m) – (E1) | Linear Gamma form | a=500, b=1000 | Distance <500 equals 0, 500 – 1000 increases from 0 – 1, and >1000 equals 1 |
| Distance to shoreline location (m) – (E2) | Linear Gamma form | a=1000, b=2000 | Distance <1000 equals 0, 1000 – 2000 increases from 0 – 1, and >2000 equals 1 |
| Distance to sea turtle feeding areas (m) – (E3) | Linear Gamma form | a=500, b=1000 | Distance <500 equals 0, 500 – 1000 increases from 0 – 1, and >1000 equals 1 |
Step 3: Evaluate the results
After determining the membership functions for each criterion, the research team evaluated the results using GIS.
2.3. Methods of using GIS (Geographic Information System)
According to the US Geological Survey (USGS) and the Environmental Systems Research Institute (ESRI), in general, a geographic information system is defined as a system used to store data. Store, manipulate, analyze, manage and present all types of geographic data. Currently, GIS has been widely applied in many fields such as energy, environment, agriculture, transportation, hydrometeorology… In the article, QGIS 3.20.2 software – open source code – is used. used for analysis and calculations.
After collecting all the spatial data layers that need to be analyzed and having all the values for each criterion, the sequence of processing and analysis steps in GIS is presented as Figure 2.
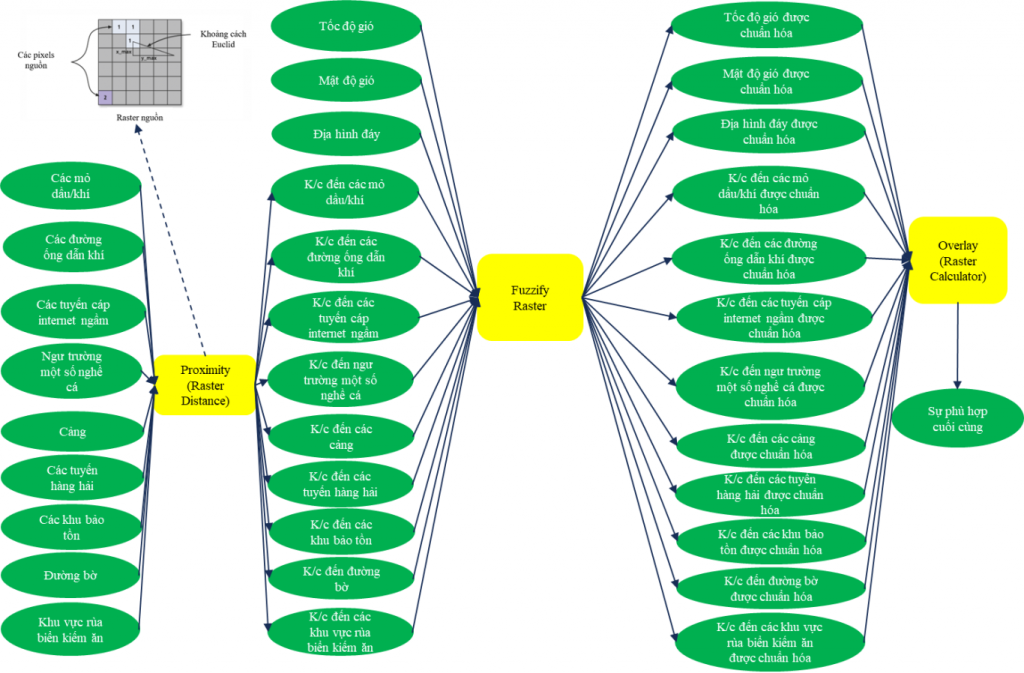
Figure 2. Flow of processing and analyzing data in GIS
 |
 |
 |
 |
 |
 |
 |
 |
 |
 |
 |
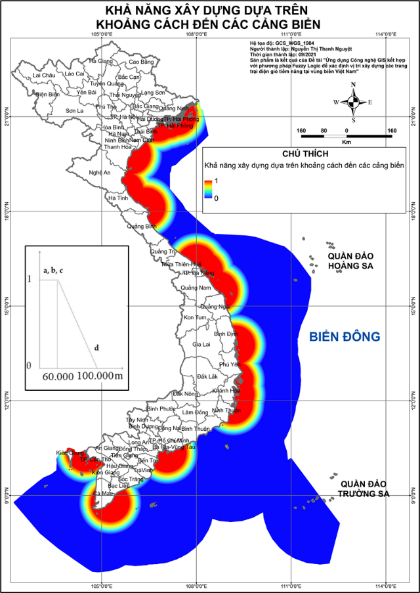 |
Figure 3. Criterion classes after Fuzzy normalization
2.4. Technical wind energy calculation method
To calculate the technical potential in the study area, the team will eliminate areas smaller than 10 square kilometers as recommended by the World Bank’s Energy Management Support Program and assume developers The investment will use the V162-6.2 MW™ turbine for areas with wind speeds greater than or equal to 6 m/s corresponding to level II winds. Thus, with the above assumptions and according to the layout of the distance between turbines as designed by the AG Renewable Energy Academy as shown in Figure 4, there will be about 19 wind turbines in a wind farm and the achieved capacity is 11 .78 MW per square kilometer.
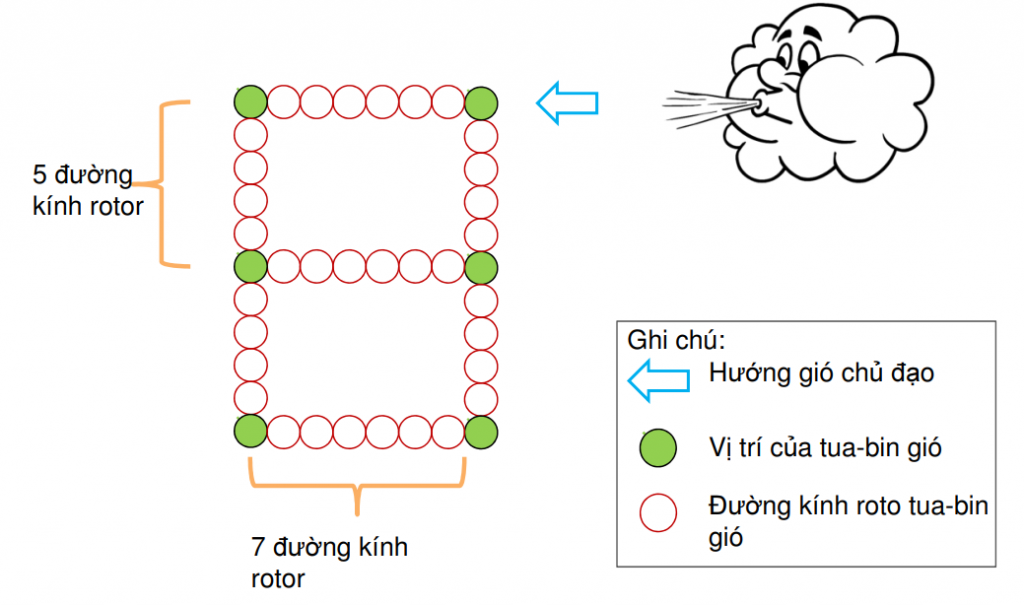
Figure 4. Spacing between turbines to reduce tailing effects
3. RESULTS
The results of the potential area that can be built after calculation are shown in Figure 5. The results show that the pixels in the research area have values ranging from 0.47 – 1 with the concentration level. The data are mainly from 0.71 – 0.92 and the average value is close to 0.82.
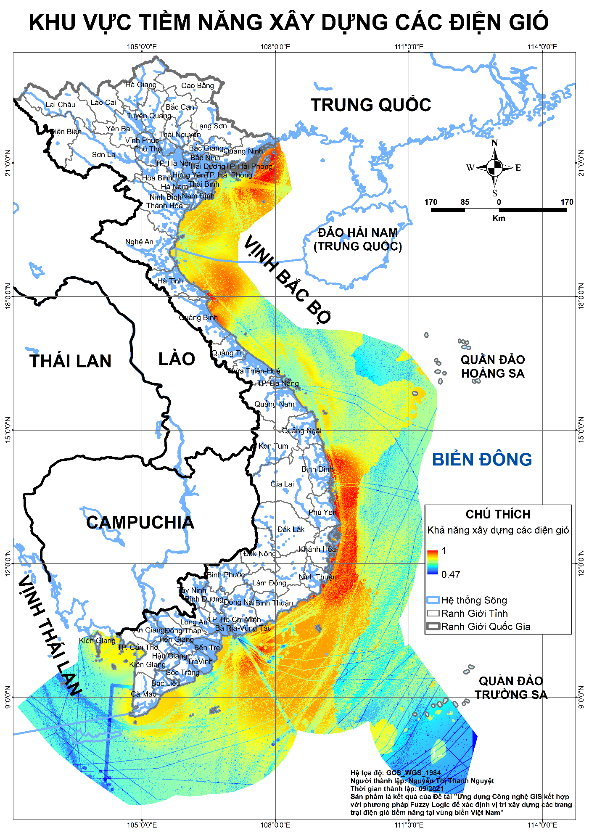
Figure 5. Results of areas capable of building offshore wind power plants
Using the percentile stratification method combined with examining actual planned and built project locations, the research team determined the appropriate threshold value for the entire scope of the study area. with a pixel value above 0.88 – meaning that area meets almost all 12 criteria (wind speed, wind energy density, bottom terrain, distance to oil/gas fields, distance to gas pipelines, distance to underground internet cables, distance to some fishing grounds, distance to seaports, distance to maritime routes, distance to protected areas, distance distance to shoreline location, distance to sea turtle feeding areas).
Table 3: Area of area capable of building offshore wind farms and corresponding capacity
| Potential area | Acreage (Km2) | Power (GW) |
| Nearshore wind power | 14.329,71 | 142,35 |
| Fixed foundation offshore wind power | 45.879,40 | 327,40 |
| Floating foundation offshore wind power | 70.020,86 | 417,12 |
| Total research area | 602.243,40 | 886,87 |
Of the total area of the study area of more than 600,000 km2, the potential construction area accounts for more than 21.62%, equivalent to 130,229.97 km2. Of which, the potential area for near-shore wind power construction (area with water depth less than 20 m) is nearly 14,330 km2, equivalent to 11.00% of the total potential area, mainly concentrated in coastal areas. Quang Ninh province, City. Hai Phong, Thai Binh, Nam Dinh, Thanh Hoa, Nghe An, Ha Tinh, Quang Binh, Ninh Thuan, Binh Thuan, Ba Ria – Vung Tau, City. Ho Chi Minh, Tien Giang, Ben Tre, Tra Vinh, Bac Lieu and Ca Mau. The remaining potential area is offshore wind power accounting for 89% (nearly 116,000 km2), specifically:
+ Fixed foundation offshore wind power (water depth below 50 m) accounts for 35.23% – equivalent to 45,879.40 km2, distributed in the provinces: Quang Ninh, Hai Phong, Thai Binh, Nam Dinh, Thanh Hoa , Nghe An, Ha Tinh, Quang Binh, Quang Tri, Quang Ngai, Binh Dinh, Phu Yen, Khanh Hoa, Ninh Thuan, Binh Thuan, Ba Ria – Vung Tau, Tien Giang, Ben Tre, Tra Vinh, Soc Trang, Bac Lieu and Ca Mau.
+ The remaining more than 70,024 km2 (53.77%) of the area has the potential to build floating foundation wind power plants with a water depth of 50 – 1,000 m, distributed almost offshore in provinces and cities such as Hai Phong. , Thai Binh, Thanh Hoa, Nghe An, Ha Tinh, Quang Binh, Quang Tri, Quang Ngai, Binh Dinh, Phu Yen, Khanh Hoa, Ninh Thuan, Binh Thuan, Ba Ria – Vung Tau, Tien Giang, Ben Tre, Tra Vinh, Soc Trang and Bac Lieu.
4. CONCLUSION AND RECOMMENDATIONS
Using GIS technology combined with Fuzzy logic (for 12 criteria (wind speed, wind energy density, bottom terrain, distance to oil/gas fields, distance to gas pipelines, distance to underground internet cable routes, distance to some fishing grounds, distance to seaports, distance to maritime routes, distance to protected areas, distance to shoreline locations, distance to sea turtle feeding areas)), the research team created a map of potential wind farm construction areas in the study area that fairly reflects the map of offshore wind potential in Vietnam in 200 km range under the World Bank’s Energy Management Support Program announced in 2019.
Since each pixel is classified based on its ranking value, that information is very useful for agencies, policy makers or investors who can shorten the time in identifying construction investment areas. build.
However, the study did not consider geological factors, fish habitat, and weather as well as factors related to natural disasters such as storms and earthquakes. In addition, there needs to be more in-depth research on the impact of offshore wind power projects on the ecosystem, thereby determining the scope of impact of wind power farms on them specifically in each locality as well as each area before proceeding with installation.
Acknowledgments: The authors would like to sincerely thank Power Construction Consulting Joint Stock Company 2 for supporting and creating favorable conditions for the group to complete the article. This research was carried out during the implementation of a Company-level science and technology project at PECC2, with code NCKH.SK25.10.012/21, project name “Application of GIS technology combined with Fuzzy logic method to determine the location of potential wind power farms in Vietnamese waters.”
Nguyễn Thị Thanh Nguyệt1, Dư Văn Toán2
1 Power Engineering Consulting Joint Stock Company 2, Electricity of Vietnam
2 Institute for Sea and Island Research, Vietnam General Administration of Seas and Islands
(Source: Article in Environment Magazine, Vietnamese Topic 1, 2023)
CPA Consulting translates content for reference
REFERENCES
1. Ministry of Transport, Southern Maritime Safety Corporation (2021). Maritime Notice No. 168/TBHH-TCTBDATHHMN Regarding the coordinates of undersea gas pipeline systems, access at https://www.vms-south.vn/thong-bao-hang-hai/thong-bao/ve-toa-do-cac-he-thong-duong-ong-dan-khi-duoi-bien-2, on October 30, 2021.
2. Nguyen Thi Bay (2021). Project “Research to determine the causes, mechanisms and propose technically feasible and economically effective solutions to limit erosion and sedimentation for the Mekong Delta river system” code KHCN -TNB.DT/14-19/C10.
3. Vietnam Energy Transition Initiative (2021). Map of oil and gas exploitation area.
4. Seafood Research Institute, Ministry of Agriculture and Rural Development (2019). Map of fishing grounds of some fisheries.
5. World Bank Group, ESMAP, VORTEX, DTU. https://globalwindatlas.info/ accessed August 29, 2021.
6. SeaRates. https://www.searates.com/maritime/vietnam.html accessed August 29, 2021.
7. Vietnam Port Association. http://www.vpa.org.vn/capacties/ accessed August 29, 2021.
8. JETRO (2010). Viet Nam Energy Map, https://www.jetro.go.jp/ext_images/jfile/report/07000429/vn_energy_map.pdf?fbclid=IwAR1pyUWJCCPU5RaIuuyycPDo4RGAptgsXMPQ7Du4Z4Djo2_VbXoOOwIxLXM,https://www.arcgis.com/apps/View/index.htmlappid=48668fbfa02f4ab292325cf758b7f325&fbclid=IwAR35tqtTYklGB5C2G70LVdIYDIvyOQB60R3rBdq67xtoEPA_bhsR9Sg9hf8 Vietnam Port Association.
10. GEBCO, https://www.gebco.net/ Vietnam Port Association.
11. Greater Mekong Subregion Environment Operations Center (2021). http://portal.gms-eoc.org/maps Vietnam Port Association.
12. MarineTraffic Company. https://www.marinetraffic.com/ Vietnam Port Association.
13. TeleGeography (2021). The Submarine Cable Map, https://www.submarinecablemap.com/country/vietnam Vietnam Port Association.
14. Protected Planet (2021). https://www.protectedplanet.net/country/VNM truy cập ngày 29/8/2021.
15. International Union for Conservation of Nature (IUCN), https://www.iucn.org/asia/countries/viet-nam Vietnam Port Association.
16. ESRI (Environmental Systems Research Institute). Map of oil and gas fields in the southern region of Vietnam Oil and gas fields in the south, https://www.arcgis.com/apps/View/index.html,appid=48668fbfa02f4ab292325cf758b7f325&fbclid=IwAR35tqtTYklGB5C2G70LVdIYDIvyOQB60R3rBdq67xtoEPA_bhsR9Sg9hf8, Vietnam Port Association.
17. The World Bank (2021). Global Shipping Traffic Density, https://datacatalog.worldbank.org/search/dataset/0037580/Global-Shipping-Traffic-Density, Vietnam Port Association.


How can I help you?
Please contact us:
Tel: 0964203405
Email: info@cpacorp.vn